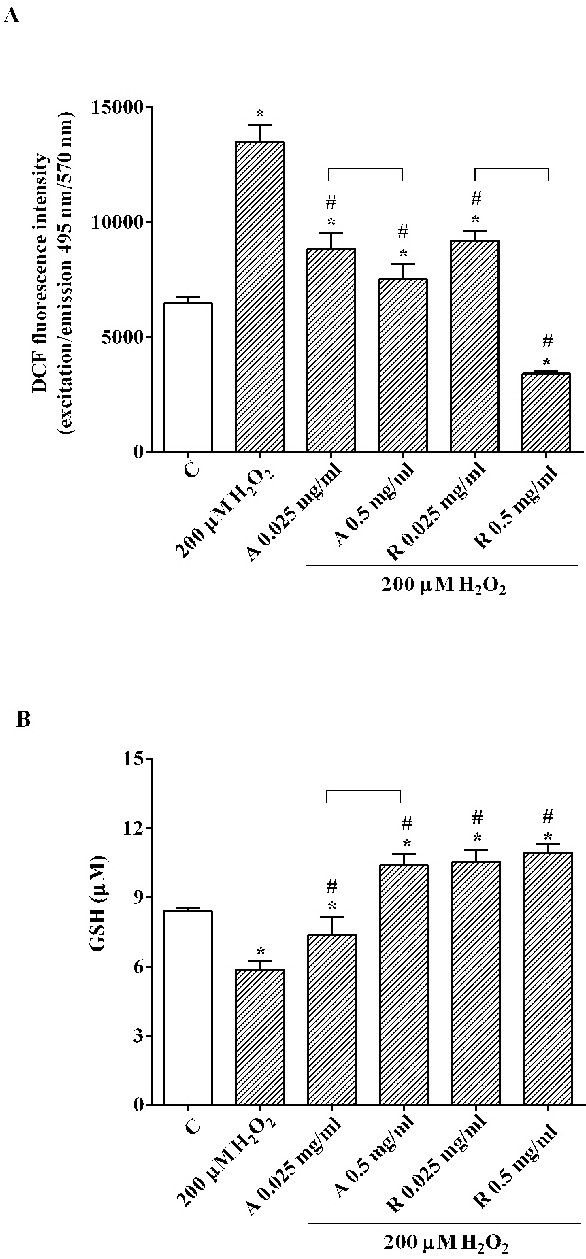
Fig. 6. Effects of HUVEC/RPE cells co-culture on ROS (A) and GSH (B) production in RPE cells. Abbreviations are as in previous Fig.s. In A, results are expressed as DCF fluorescence intensity, which is proportional to the amount of intracellular ROS. In B, results are expressed as GSH (µM) produced after each stimulation. Reported data are means ± SD of five independent experiments for each experimental protocol. Significance between groups: *P<0.05 vs C; #P<0.05 vs 200 μM H2O2. Short square brackets indicate significance between groups (P<0.05).